A technical study of daily equity forecasting under strict evaluation
Forecast what the evidence allows.
How a free-data pipeline, purged walk-forward testing, pre-declared gates, and an immutable live forecast log separated what could be predicted from what could not, and turned the result into a daily forecasting service.
Part I / The question
Ask what can actually be forecast.
The project began with a familiar goal: predict whether a stock will rise or fall. Instead of tuning toward a headline accuracy number, every model was held to a baseline it had to beat on data it had never influenced. Across twenty-four trained models, no daily direction forecast, next-day or five-day, cleared that bar. Two other targets did: how far a stock is likely to move, and which stocks are likely to beat the others over the next week.
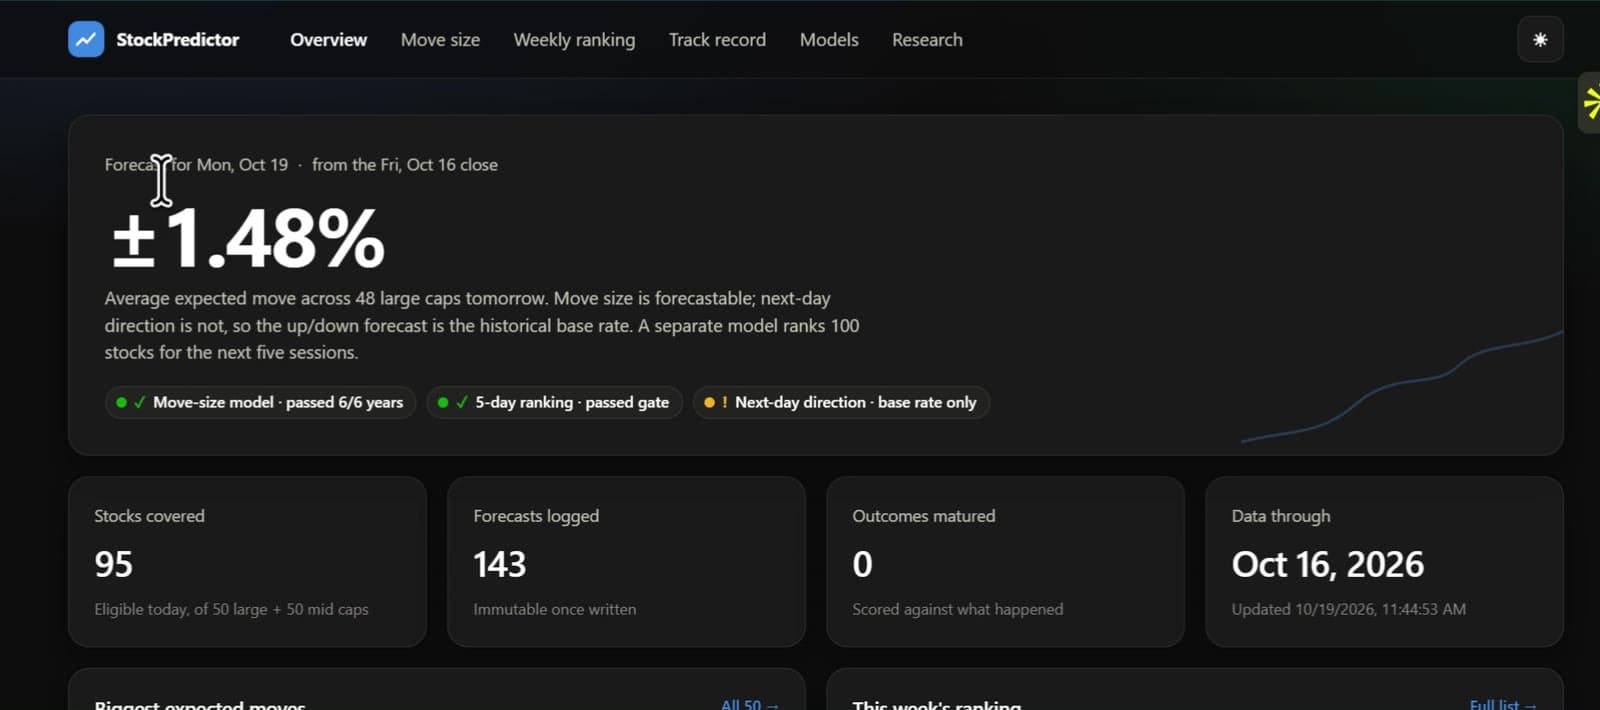
Those two results became the product. After every trading session the system forecasts the next session's move size with a calibrated range for fifty large caps, ranks one hundred large and mid caps for the following five sessions, writes both as immutable files, and scores them once the outcomes exist. The up/down probability is shown as the historical base rate, labeled as such.
| Published output | Universe | Evidence status |
|---|---|---|
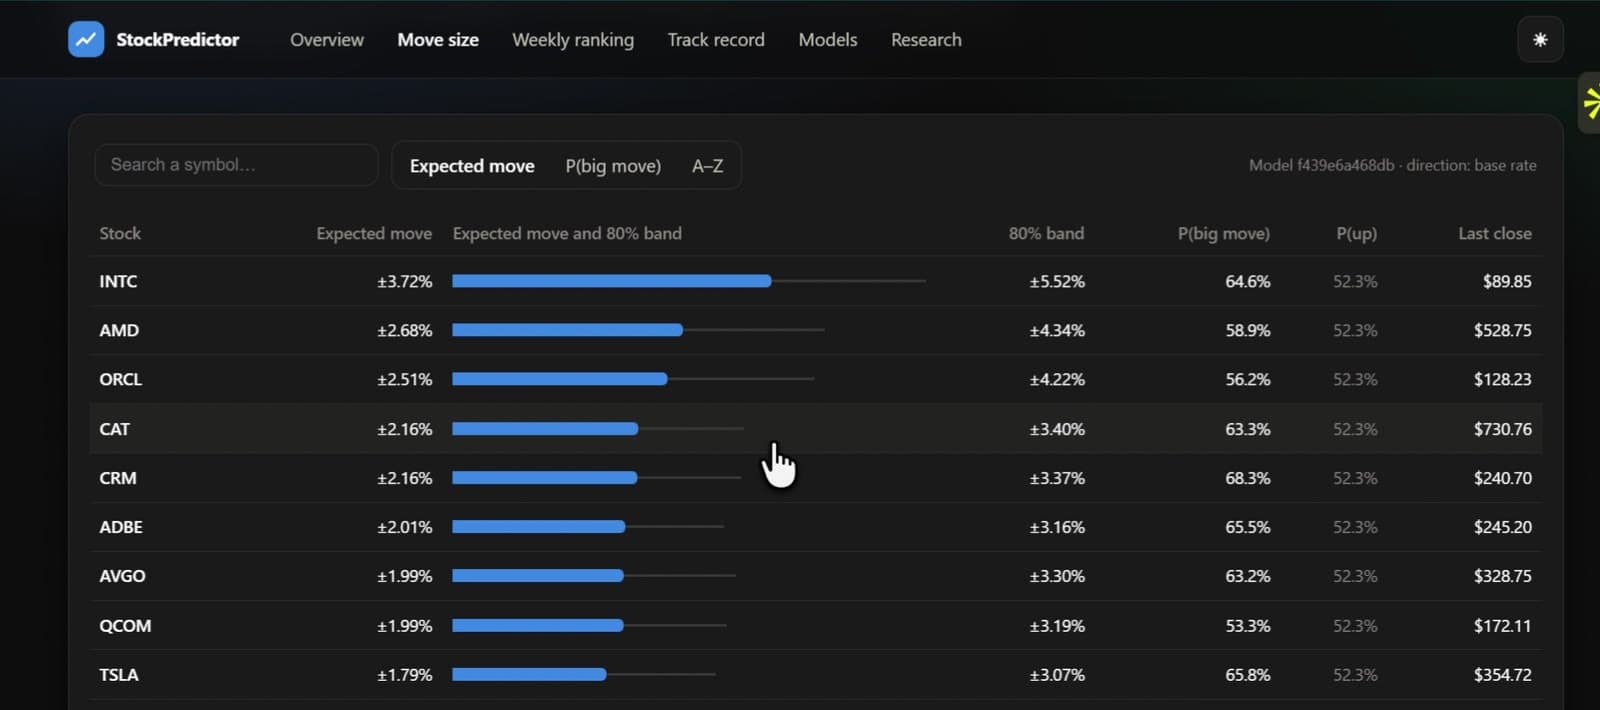
| Expected absolute move, 80% band, P(big move) | 50 large caps | Passed its gate in 6 of 6 walk-forward years |
| Five-session cross-sectional ranking | 50 large caps + 50 S&P MidCap 400 members | Passed its gate; strongest among mid caps |
| Next-session up probability | 50 large caps | Base rate only; no model beat it |
Part I / The question
Heavy compute in the pipeline, light serving at the edge.
Collection, feature building, training, FinBERT scoring, and inference need LightGBM, a transformer model, and the full dataset, so they run on GitHub Actions runners rather than in request-time functions. Vercel serves the results: a read-only FastAPI function and a static React dashboard. The private S3-compatible archive is the immutable record; PostgreSQL holds a query copy for the API.
| Layer | Implementation | Boundary |
|---|---|---|
| Research & pipeline | Python 3.13, pandas/PyArrow, LightGBM, scikit-learn, statsmodels; uv-locked dependencies | Runs locally or on Actions with the same commands |
| Archive | Neon object storage over the S3 API; content-addressed keys and manifests | Immutable objects; only checkpoints are mutable |
| Sentiment | ProsusAI/finbert at a pinned revision in an isolated environment | Weights verified by SHA-256 before use |
| Database | Neon PostgreSQL 17 with separate migrator, writer, and runtime roles | Forecasts and rankings are append-only |
| API & dashboard | FastAPI with psycopg; React, Vite, Framer Motion, hand-built SVG charts | Read-only; dashboard falls back to a bundled snapshot |
Part II / Data you can audit
Free sources, archived before they are trusted.
The pipeline uses only free data. Every HTTP response, including failures, is wrapped in an envelope with its request, status, selected headers, and body, then stored under the SHA-256 of its content before any parsing happens. Query credentials and any echoed secrets are redacted from the archived bytes. Collectors are rate limited, honor Retry-After, bound response sizes, and resume from checkpoints that only advance after the remote write is confirmed.
| Source | Used for | Measured collection |
|---|---|---|
| Alpaca historical SIP bars | Daily OHLCV for 50 stocks and SPY | 138,210 bars, 2016-01-04 to 2026-10-13, 2,710 sessions |
| Alpaca (Benzinga) news | Timestamped headlines for news and sentiment features | 242,087 articles, 2015 to 2026, all 50 stocks |
| SEC Company Facts & filings | Earnings dates, earnings surprise, filing events | 964,419 facts; 9,836 filing records |
| FRED / ALFRED | Macro series as they were known at each date | 31,328 observation rows across six series |
| GDELT, company IR pages | Event and announcement candidates | Partial; blocked sources recorded as gaps |
Several sources failed in practice: GDELT article search returned HTTP 429 and tripped a circuit breaker, and nineteen investor-relations pages returned HTTP 403. Those failures are retained as missing coverage. They are never converted into zero-news features, because a source that failed is different from a day with no news.
Part II / Data you can audit
Outcomes never leak into inputs.
Cleaning works on the exchange calendar, not on calendar days. Of 138,210 bars, 138,202 are valid canonical rows with no missing sessions. Seven unsupported corporate-action or identity boundaries and one unexplained price jump are quarantined: their future-label intervals are excluded and feature history restarts after them. Range features also cap erroneous provider wicks, such as a pre-split print, at four times the stock's previous 22-session volatility.
Features use only information available by the session close plus thirty minutes. Labels are generated by separate code from future prices. Blocks are split on whole session dates so every stock for a day stays together, and examples whose label would reach into the next block are purged at each boundary.
| Block | Examples | Forecast sessions | Purged boundary rows |
|---|---|---|---|
| Train | 84,363 | 2016-12-30 to 2023-10-06 | 245 |
| Validation | 12,059 | 2023-10-16 to 2024-10-04 | 245 |
| Calibration | 12,133 | 2024-10-14 to 2025-10-06 | 250 |
| Test | 11,989 | 2025-10-14 to 2026-10-06 | 0 |
The first dataset carries 34 core features; the next-day work extends them to 191 price factors in the style of Alpha158. Later studies add volatility, earnings-event, earnings-surprise, news-volume, sentiment, cross-sectional, and slow-momentum groups, each built with the same cutoff rule and checked by tests that change only future rows and confirm features are unchanged.
Part III / What the models found
Direction did not move.
Direction was attacked from every reasonable angle: tree ensembles, linear and ARIMA baselines, recurrent and convolutional networks, a residual MLP, a 209M-parameter time-series foundation model, macro vintages, SEC fundamentals, historical headlines, FinBERT sentiment, and FinBERT fine-tuned on the headlines themselves. Each was compared on identical rows with a fixed selection rule.
| Study | Model result | Baseline on the same rows |
|---|---|---|
| Five-session UP / FLAT / DOWN | LightGBM 40.73% accuracy | Logistic 41.49%; prior 40.28% |
| Next-session UP / FLAT / DOWN | LightGBM 42.83%; LSTM 42.72% | Always FLAT 43.51% |
| Daily CNN-LSTM | 43.39%, but 0% DOWN recall | Always FLAT 43.51% |
| Timestral-209M, zero-shot | 43.20% accuracy | Always FLAT 43.51% |
| Two-head direction, six years | Pooled AUC 0.498 | Training prior in 0 of 6 years |
| + news, sentiment, earnings surprise | Pooled AUC 0.494 | Beat the prior in 1 of 6 years |
| FinBERT fine-tuned on headlines | Direction AUC 0.500 | Never beat the base rate |
A diagnostic explains why this was expected. Even with perfect knowledge of the next day's market return, three-class accuracy on the 2025-2026 block would only reach 48.3%. Public headlines available at the close carry no measurable next-day direction signal for these large caps; the market has already priced them.
Part III / What the models found
Move size is forecastable.
The two-head design separates what is predictable from what is not. The magnitude head forecasts the expected absolute next-session return with LightGBM, an 80% quantile band with split-conformal scaling, and a calibrated big-move probability. The direction head chooses between the training prior, logistic regression, and LightGBM by inner-validation log loss. Three-class probabilities are derived from both heads for display only.
| Test year | QLIKE (model) | QLIKE (HAR) | Rank correlation | 80% coverage |
|---|---|---|---|---|
| 2020-21 | −7.326 | −7.207 | 0.325 | 86.1% |
| 2021-22 | −6.829 | −6.672 | 0.313 | 78.8% |
| 2022-23 | −7.349 | −7.178 | 0.329 | 82.0% |
| 2023-24 | −7.501 | −7.198 | 0.296 | 78.8% |
| 2024-25 | −6.986 | −6.801 | 0.297 | 80.6% |
| 2025-26 | −6.986 | −6.745 | 0.312 | 78.7% |
| Pooled | −7.162 | −6.966 | 0.331 | 80.8% |
Lower QLIKE is better, and the model beats the HAR volatility baseline in every year. Sorting forecasts into quintiles gives realized average moves of 0.80%, 1.00%, 1.18%, 1.46%, and 2.31%, so the top quintile moves 2.9 times as much as the bottom. Earnings-date features account for most of the gain; earnings surprise, news volume, and FinBERT sentiment were each promoted only after improving on price-only in at least five of six years.
The production configuration keeps price plus the promoted groups, sets direction to the training prior, and was refit on all labeled history: QLIKE −7.155 against −6.966 for HAR, 80.6% band coverage, and a big-move AUC of 0.591. It scores marginally below the all-groups model because the promotion rule dropped a group that only helps in combination. The rule was not overridden after seeing those test years.
Part III / What the models found
Rank the week, not the day.
Ranking reframes direction as a relative question: which stocks will beat the others? LightGBM is trained on each row's percentile rank of forward return within its session, over 445 inputs that are rank-normalized per session. Evaluation uses daily Spearman rank IC with t-statistics on non-overlapping sessions, and a long-short portfolio of the top and bottom quintiles, net of costs.
| Horizon | Mean rank IC | Years IC > 0 | t (non-overlapping) | Net Sharpe at 5 bps | Gate |
|---|---|---|---|---|---|
| 1 day | +0.022 | 6 of 6 | 4.62 | 0.04 | Passed, economically nil |
| 5 days | +0.023 | 5 of 6 | 2.66 | 0.97 (0.51-1.01 by start day) | Passed |
| 20 days | +0.022 | 4 of 6 | 0.68 | 0.43 | Failed |
At five sessions the model beats 12-1 month momentum, five-day reversal, and low-volatility baselines. Most of the edge comes from the mid-cap cohort, which also carries the most survivorship bias. The reported Sharpe of 0.97 came from the most favorable rebalance day; averaged across all five start days it is 0.73, so the honest reading is roughly 0.5 to 0.75, with rank IC as the more stable measure.
A GPU comparison later trained eight rankers, including XGBoost, CatBoost, LambdaRank, an MLP, and an ensemble, with the winner chosen in advance by inner-year IC. The pre-selected ensemble failed its gate, and the model with the best test IC had ranked second-last on the inner years. Promoting it would have meant choosing on test results, so the live ranker stayed unchanged.
Part IV / Evaluation discipline
Gates are set before the test is opened.
Every study uses expanding yearly walk-forward folds: six test years, each preceded by an inner-validation year used for early stopping, calibration, conformal scaling, and model choice. Training labels end before the inner year, inner labels end before the test year, and rows whose outcome would fall in the reserved prospective block are never touched.
| Gate | Rule |
|---|---|
| Magnitude | QLIKE below HAR in at least 5 of 6 folds and pooled; pooled 80% coverage within ±3 points |
| Direction | Log loss below the training prior in 5 of 6 folds and pooled AUC ≥ 0.52 |
| Feature group | Adding the group improves on price-only in 5 of 6 folds and pooled |
| Ranking | Positive IC in 5 of 6 years, pooled t ≥ 2, and positive net Sharpe |
The first trained bundle bound its final test archive to the exact recipe that selected it, so a new recipe could not reuse that holdout for another selection. Recipe hashes cover configuration, input checksums, and source files; an identical command reuses completed folds instead of refitting. A unit test scrambles every test-block label and confirms that predictions do not change.
Part V / The live system
One forecast per session, never revised.
A scheduled workflow runs at 22:45 UTC on weekdays, more than thirty minutes after the close in both EST and EDT. It pulls live state from the archive, refreshes bars, SEC filings, and news, scores only headlines that have no FinBERT score yet, rebuilds every feature group with the exact study code, and forecasts the newest session with the production bundle.
| Step | Guarantee |
|---|---|
| Load the production bundle | Every LightGBM text model and parameter file is checked against its SHA-256 before loading |
| Write the forecast log | One file per origin session; a second run with different values fails instead of overwriting |
| Archive the log | Remote keys are immutable; a changed forecast for an existing origin is rejected |
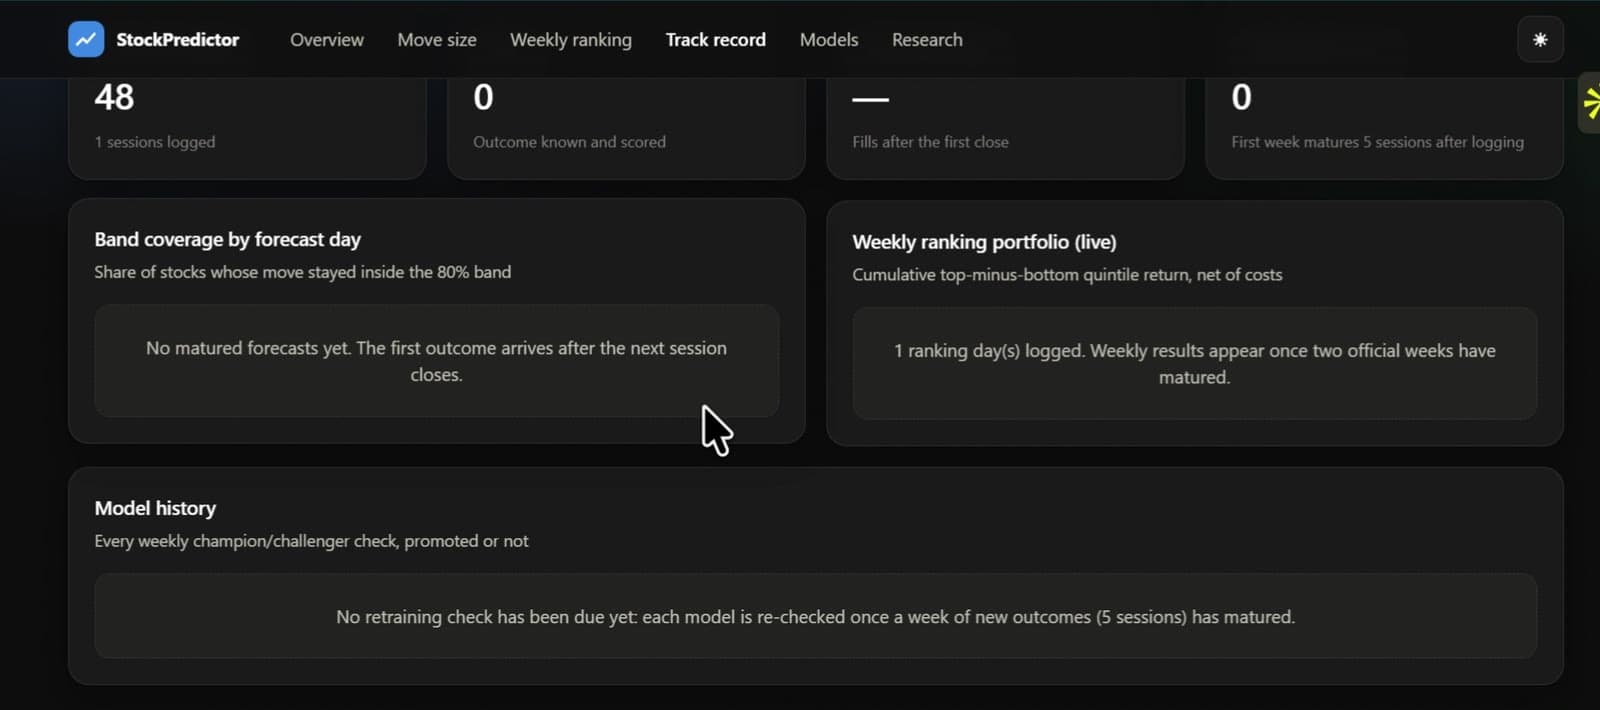
| Score matured rows | Band coverage, rank correlation, direction log loss and AUC, per origin and per model |
| Rank five sessions ahead | Official weekly portfolio forms on each week's first session so results never overlap |
Each forecast row records the expected absolute move, the 80% band, P(big move), P(up), derived class probabilities, origin and target sessions, the origin close, and the model recipe that produced it. A parity check rebuilt the 191 price features through the live path and matched the frozen dataset on all 4,700 overlapping rows.
Part V / The live system
A challenger has to earn production.
Both live models retrain weekly through a champion/challenger check. The champion stays frozen between retrains so each logged forecast tests the model that made it. A retrain becomes due once five new sessions of outcomes have matured after the champion's training data ends; the trigger is data-driven, so a missed day only delays it.
| Policy | Move-size model | Five-session ranker |
|---|---|---|
| Cadence | 5 new matured sessions | 5 new matured sessions |
| Holdout | Newest 63 labeled sessions (about 13 weeks) | Newest 63 labeled sessions |
| Challenger | Champion's exact configuration and features | Champion's exact configuration and inputs |
| Comparator if champion never saw the holdout | Champion's QLIKE | Champion's mean daily rank IC |
| Comparator if it did | HAR baseline QLIKE, coverage within ±3 points | Mean rank IC at or above 0 |
A passing challenger is refit on all history including the new week, saved as a new checksummed bundle, and the production pointer moves to it. Every evaluation, promoted or not, is appended to a JSON Lines registry, published to the model events table, and shown in the dashboard's track record. A week adds about 250 move-size rows to roughly 120,000, so retraining changes the model gradually; the gate exists to stop a bad data week or a broken recipe from reaching production.
Part V / The live system
Serve the record without touching it.
After the daily jobs, the workflow exports a dashboard snapshot, publishes forecasts, rankings, scorecards, and model events to PostgreSQL, builds the static dashboard, deploys it to Vercel, and smoke-tests the API. Publishing steps run even when an earlier step fails, so a partial day still leaves an inspectable record and logs retained for ninety days.
| Database role | Permissions |
|---|---|
| schema_migrator | Applies versioned SQL migrations |
| pipeline_writer | Inserts forecasts, rankings, and model events; replaces scorecards; prunes old snapshots |
| app_runtime | SELECT only, used by the API through a pooled connection |
The API exposes health, the full dashboard snapshot, latest and per-symbol forecasts and rankings, scorecards, and model events. Responses are CDN-cached for five minutes with stale-while-revalidate, symbols are validated, and the health check reports an unreachable database as a generic 503 without connection details. The dashboard loads the newer of the API response and a snapshot bundled at build time, and says which one it is showing.
Part VI / Verification & tradeoffs
Verify the claim, and say what it cannot prove.
The repository carries tests for causality, lagged volume, exchange-calendar gaps, corporate-action reconciliation, boundary purging, holdout access order, scrambled-label invariance, artifact corruption, cached-run reuse, and interrupted-training resume. Metrics in each report were recomputed independently from saved predictions, and reloaded native-text bundles reproduced in-memory predictions. FinBERT scores computed on a Colab GPU matched a CPU re-score of a random sample exactly.
| Limit | Consequence |
|---|---|
| Survivorship | Today's index members flatter results, most visibly for mid-cap reversal bets |
| Reconstructed availability | Historical bars and actions come from later provider revisions |
| Inspected test years | Walk-forward results are retrospective; prospective logs are the clean test |
| Small portfolios | Twenty stocks per side leave Sharpe estimates uncertain by roughly ±0.4 |
| Costs | Five basis points per side is modeled; shorting costs and borrow limits are not |
The scorecard is the only evidence free of retrospective selection, and its samples start small: one session gives fifty rows exposed to the same market day. Band coverage and rank correlation become meaningful after a few weeks; ranking results need months.
- Decide the gate before opening the test, and keep the decision when it is inconvenient.
- Report the failures; they explain why the published forecasts are shaped the way they are.
- Archive raw bytes and pin every input so any number can be traced and rerun.
- Keep heavy compute in a scheduled pipeline and serve its results read-only.
- Log forecasts before outcomes exist; it is the only test that cannot be fitted after the fact.